PHILIPPE FOREST

Hi! My name is Philippe, and this is my portfolio. I'm interested in neuroscience, music, and recent advances in deep learning. I'm curious, creative, and I try to learn new stuff everyday !
MACHINE LEARNING APPLIED TO NEUROSCIENCE
Since the huge technological advance of functional Magnetic Resonance Imaging (fMRI), neuroscience have seen a surge of highly-advanced statistical techniques to try to uncover meaningful patterns in the functional data of the brain. In the following project, I present a handful of these techniques applied to functional brain data in order to make predictions on the gender, as well as the musical affinity of 152 subjects.
Data and Dataset
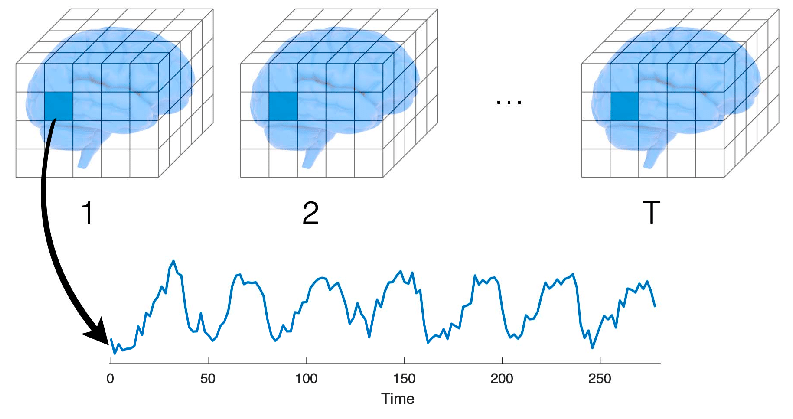
First, we need to understand what is fMRI data and how it is structured. To summarize quickly, the data corresponds to measured variations of the oxygen level in the blood, which is correlated with the activity of specific brain regions. Therefore, the higher the fMRI signal is, the more active the corresponding region is supposed to be. Inside of the scanner, one complete acquisition of the brain takes typically around 1 second, so the temporal dimension has a low resolution. However, the space is discretized in small regions called "voxels" which are typically cubes of 1 mm, so the spatial dimension is fairly high resolution. Every voxel has an associated time serie that traces its evolution over time.
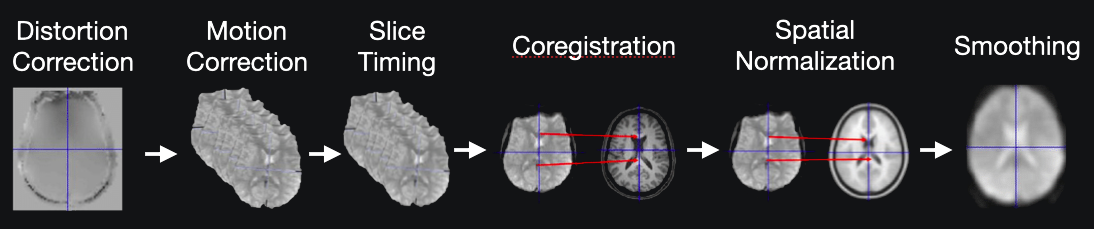
Now that we know what fMRI data is, the first step is to find a resting-state fMRI dataset. Resting-state fMRI data (data acquired when the subject is not performing any particular task) is a great way to analyze the natural connectivity patterns of individuals, and its study has revealed a number of networks which are consistently found in healthy subjects, and that represent specific patterns of synchronous activity. Furthermore, our dataset need to be pre-processed, as raw fMRI data needs to be standardized, detrended, motion corrected, smoothed, and a bunch of other steps that I will not cover in this article.
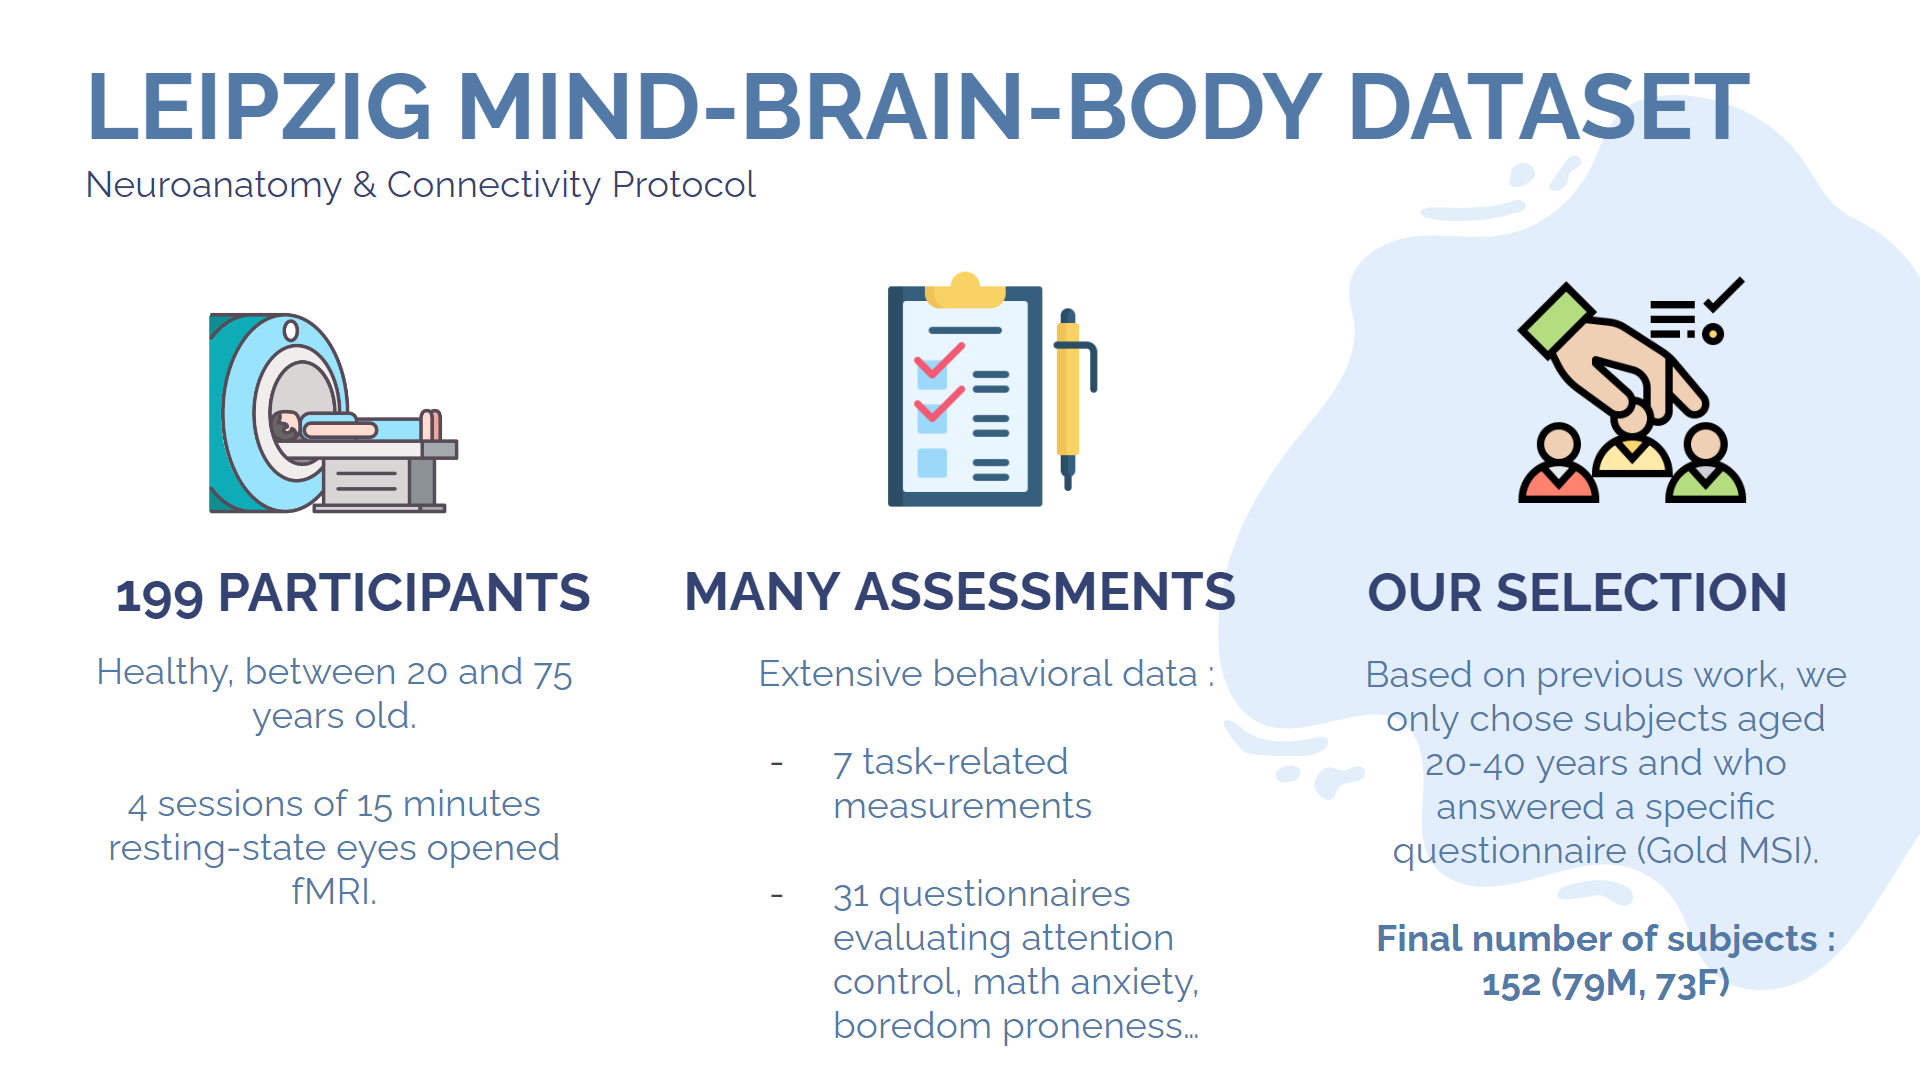
We eventually settled on using the Leipzig Mind-Brain-Body Dataset, since it possesses the criteria mentioned above, plus a bunch of extra data on the subjects, such as their answers to various questionnaires, including the Goldsmiths Musical Sophistication Index (Gold-MSI) which evaluates the musical engagement of the subject based on various factors, including academical training and self-reported capabilities.
The three types of data
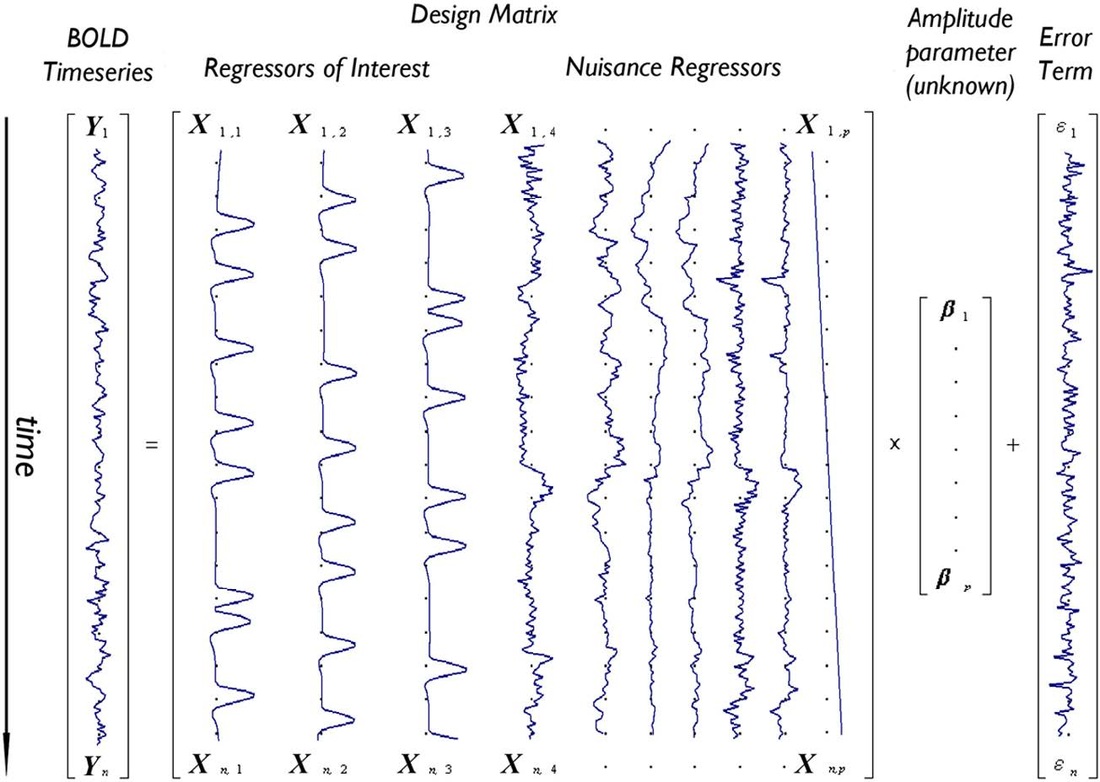
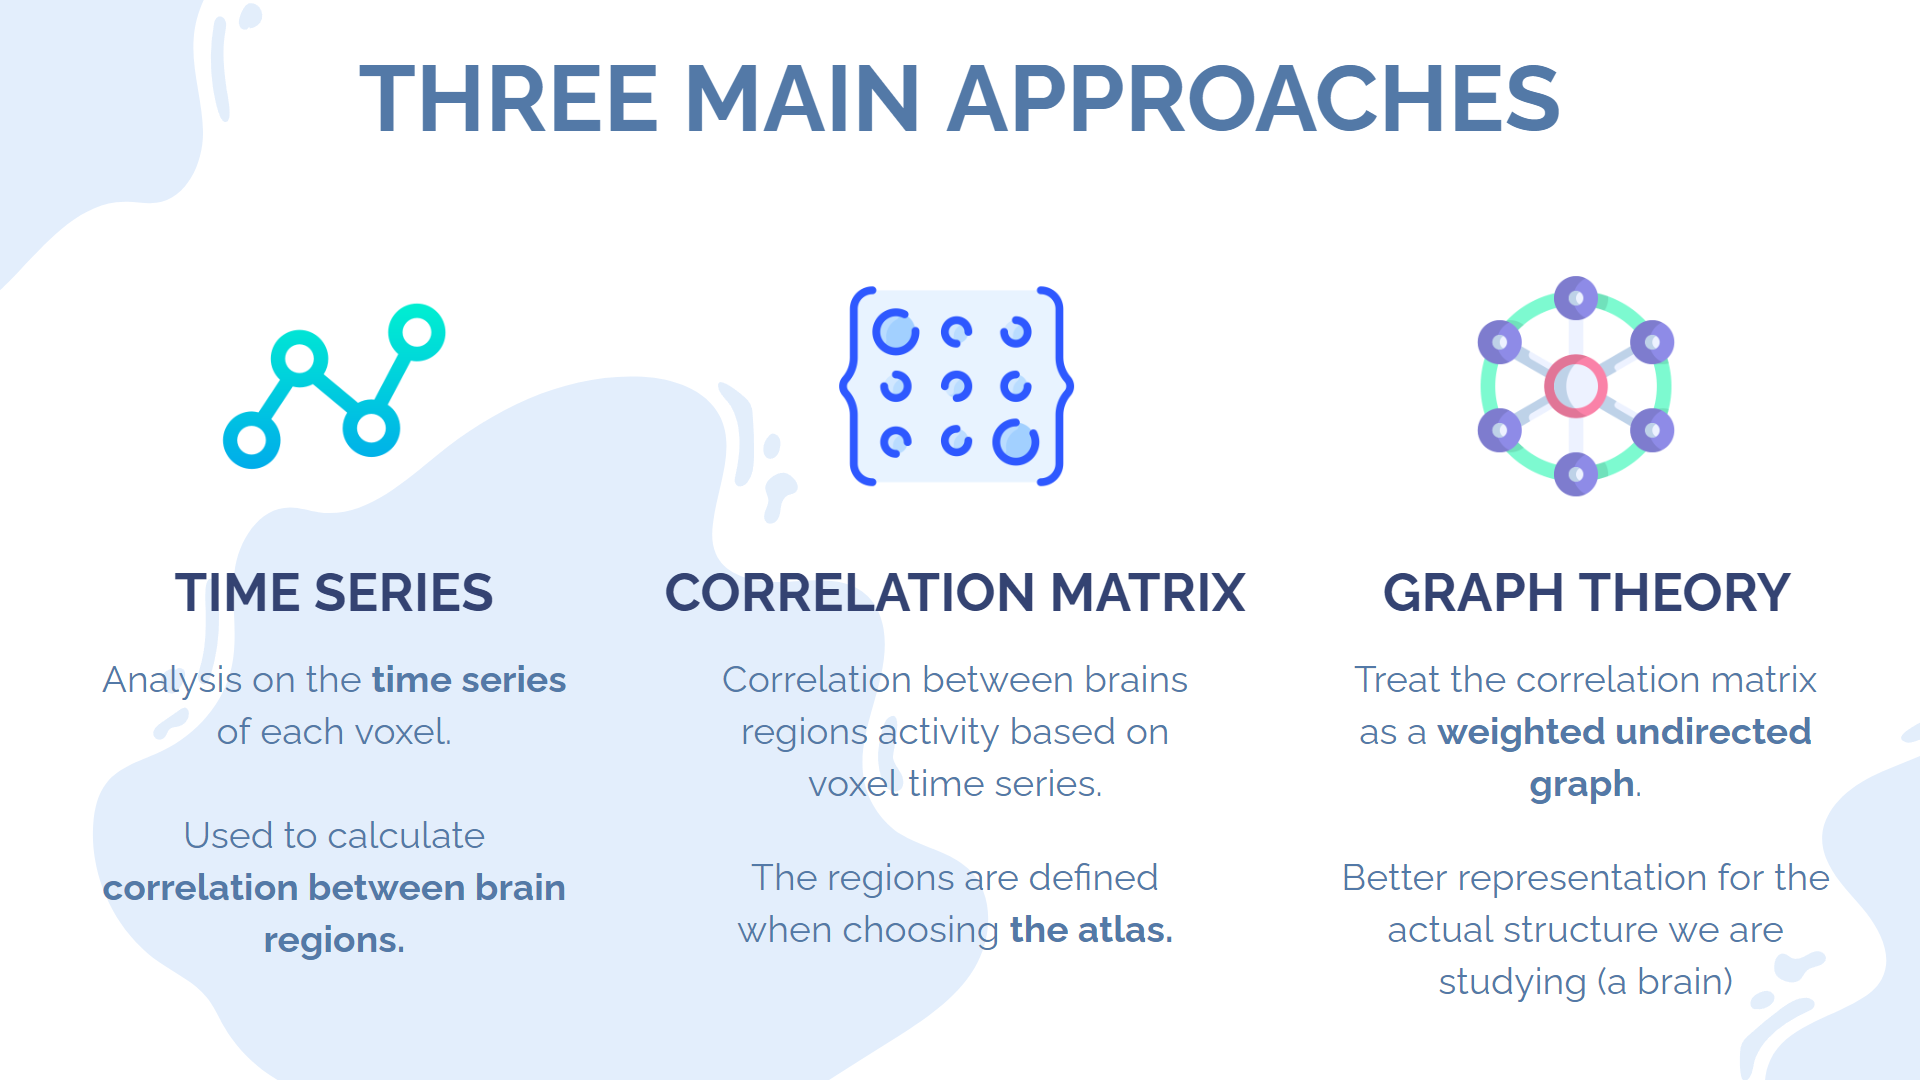
We are going to explore and use three category of functional data representation, which build on each other. The first one is simply a time serie analysis performed on each voxel individually, as part of a Generalized Linear Model (GLM). All of the time series are supposed to be independant, and we are trying to express them as the product as the design matrix by a set of unknown parameters, plus an error term. The design matrix accounts for the study design (for instance, if subjects were asked to perform a task at a given moment during the scanning) as well as the potential noise sources. I will not go into detail into the way this type of analysis work as we are not going to use it for our study, as opposed to the other two methods.
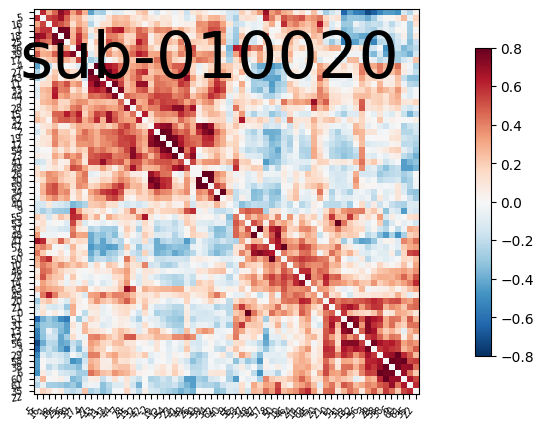
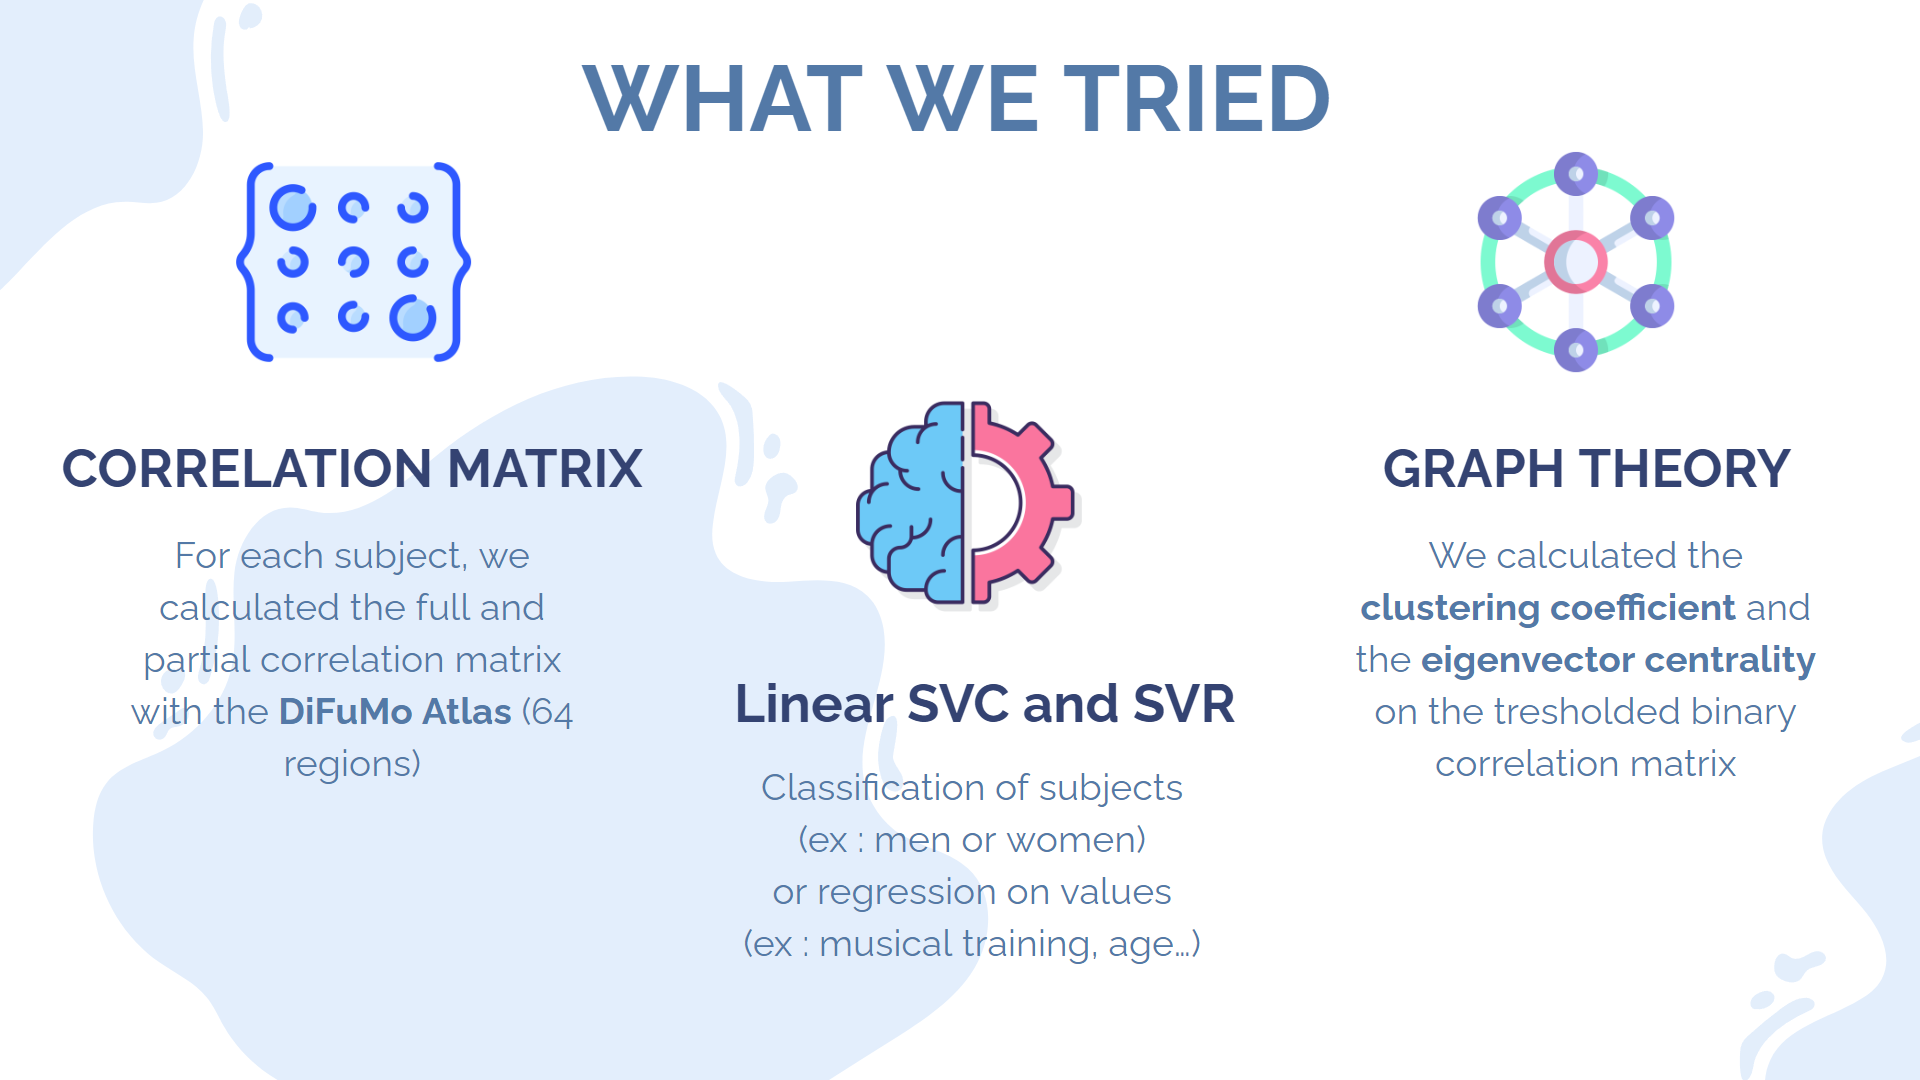
The second approach makes use of our knowledge that the brain is organised in regions that communicate together. Therefore, it would be a smart idea to cluster voxels that belongs to the same regions, and then study the correlation between the activation of these different regions over time. The result of this study is a correlation matrix (also called connectivity matrix), where each row and each column represents a specific brain region. We can then use this matrix as the input to our classification model. The database used to map each voxel to one brain region is called an atlas. Many atlases exist, and some are based on anatomical considerations, whereas others are based on statistical approaches. We decided to use DiFuMo 64, a very popular functional atlas with 64 brain regions.
The final approaches consists of taking the correlation matrix that we just computed, and treating it like an undirected graph. This data structure is very relevant to the actual structure of the brain itself, which can be conceived as an ensemble of hubs (vertices) communicating through impulses of varying strenght (edges). Furthermore, this allows us to use a bunch of tools derived from graph theory to analyse our data.
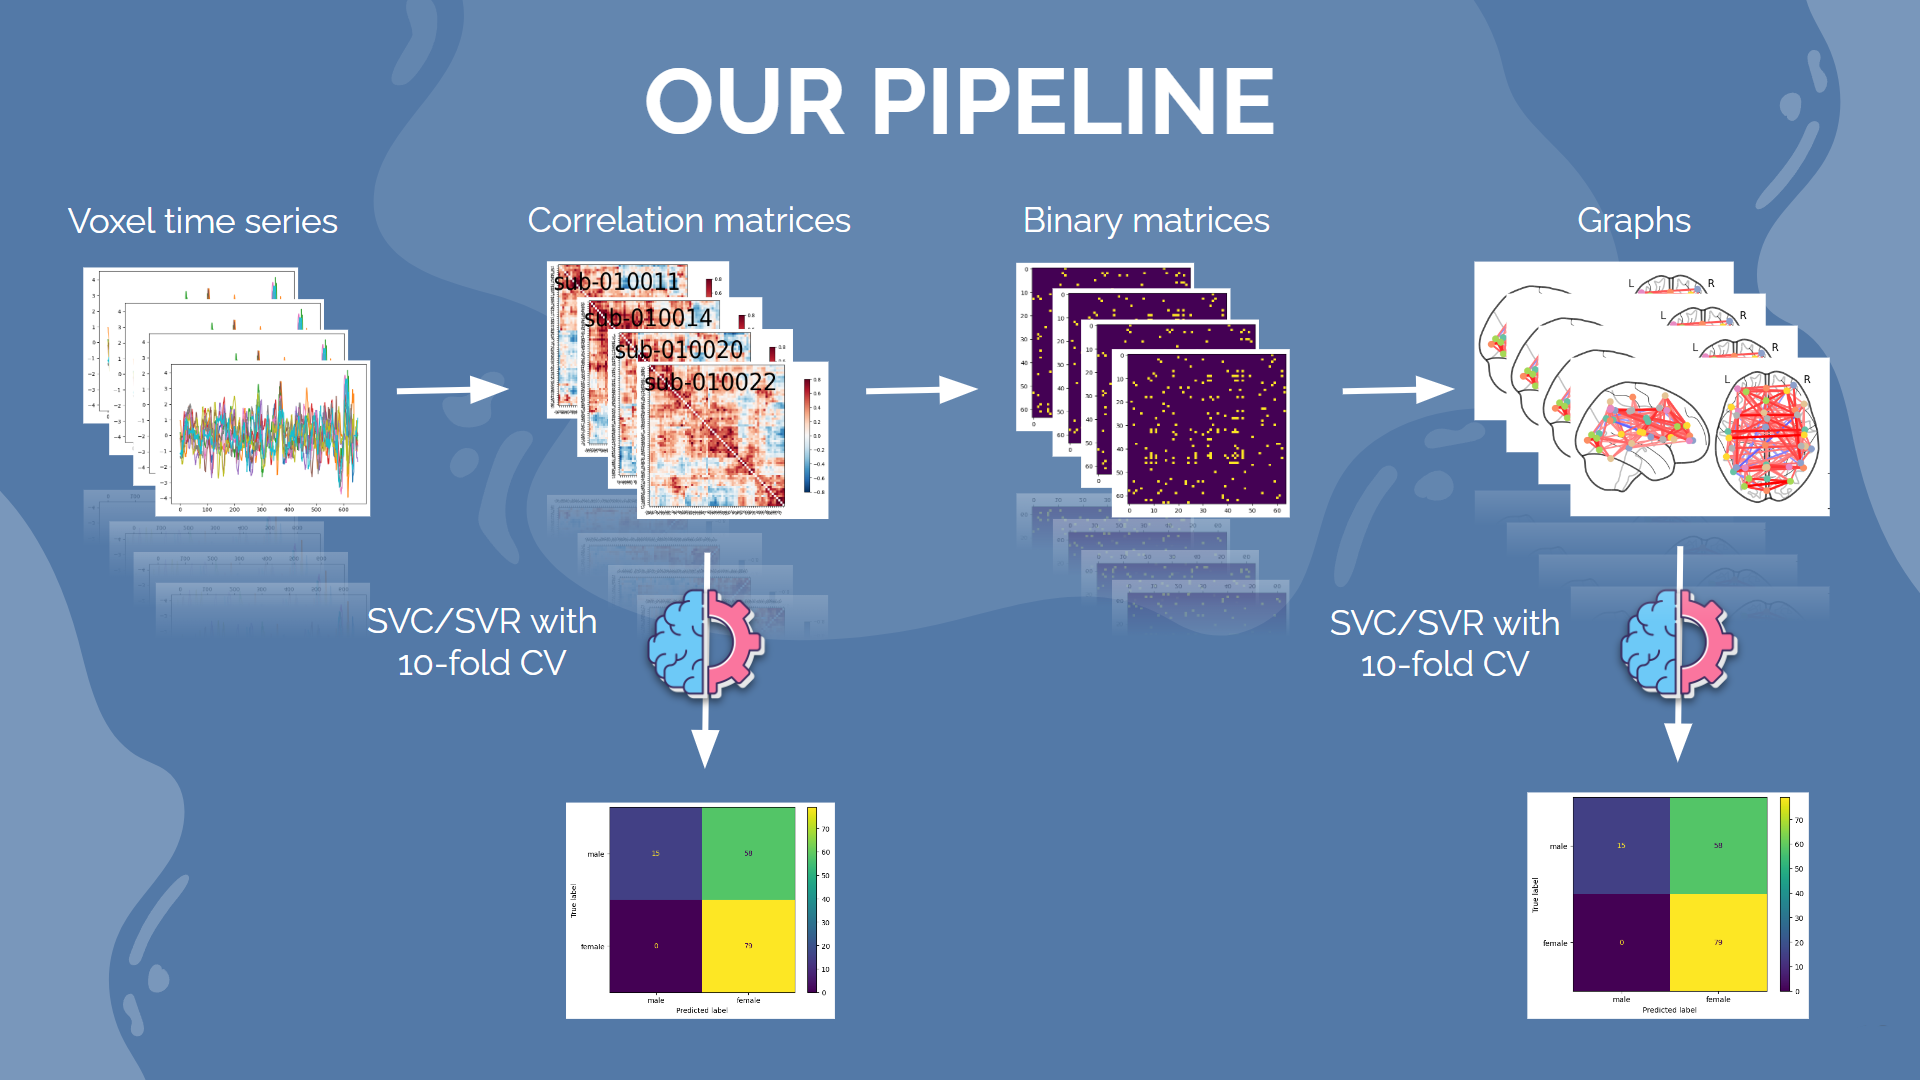
For the purpose of this project, we are going to use a very simple Support Vector Classifier (SVC) in order to make predictions. First, we will feed it the raw correlation matrixes. Then, we will treshold the matrixes to only keep the most meaningful connections, and calculate, for each node of the resulting graph, two metrics derived from graph theory : the clustering coefficient, which quantifies how close the node is to forming a complete graph with its neighbours, and the eigenvector centrality (EC), which quantifies how "important" a node is in a network, relatively to all other nodes. A node that has a high EC is connected to a lot of other nodes who themselves have high EC
Results
For each type of prediction, we performed a 5-fold cross validation, and computed the classification accuracy, as well as the f1 score. Here are the results for gender prediction, with all three methods :
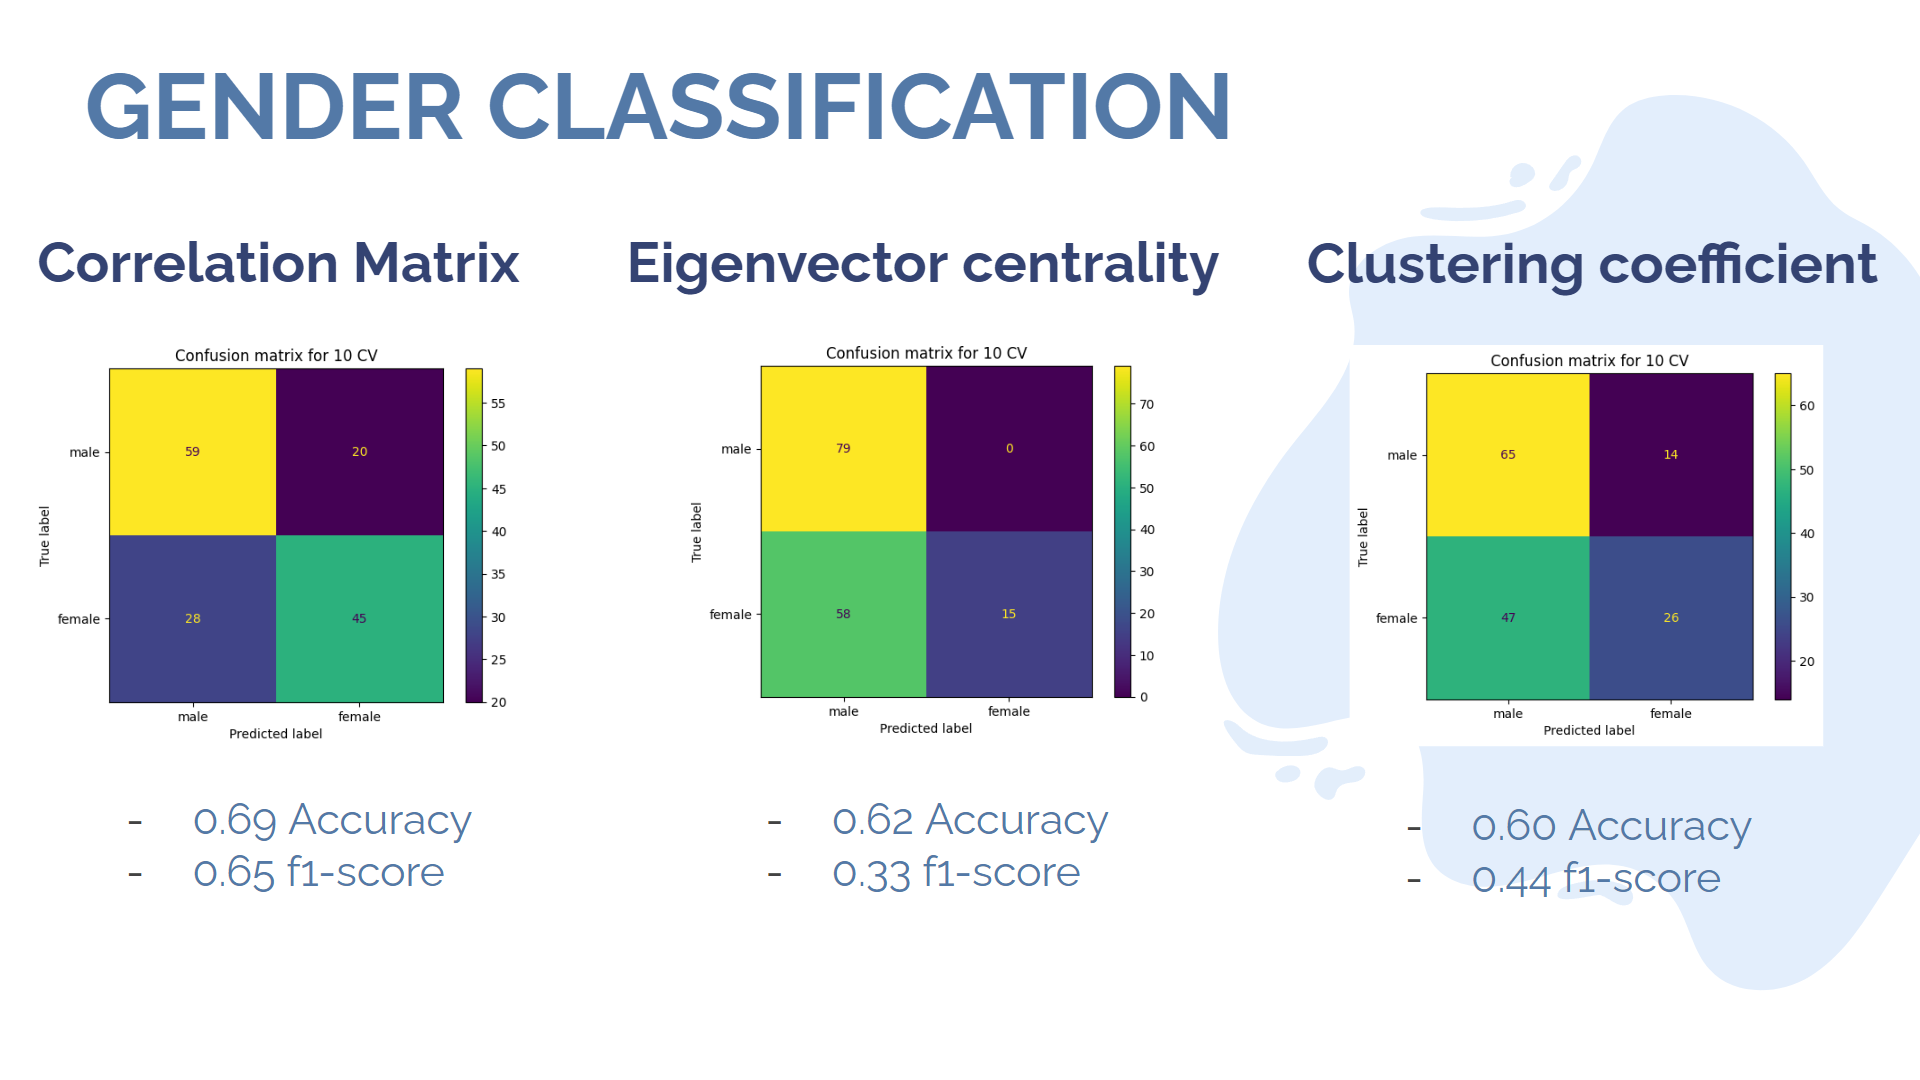
As we can see, all methods performed with an accuracy over 50%. However, there are significant differences in their respective f1 scores. Indeed, it seems like the SVC based on eigenvector centrality classified almost every subject in the male category, except 15 of them, which were all correctly classified as female. It is probably a good time to remember that our dataset was initially comprised of 79 males for only 73 females... The clustering coefficient method presents a similar behaviour, with a lower accuracy but a higher f1 score. Overall, the classification on connectivity matrices achieves both the best accuracy and the best f1 score! Now let's look at the musical sophistication score. The Gold-MSI Scale can be broadly simplified to two metrics, derived from applying PCA to the questionnaire. The "active score" quantifies the global subject engagement with music and activities related to music, whereas the "training score" quantifies the theoretical knowledge and training of the subject in music. For the purpose of our binary classification, we will say that a subject is "trained" or "active" if and only if he is above average in the corresponding metric. The following image present the results of the classification prediction, performed directly on the connectivity matrixes, as well as the repartition of each score through the whole dataset.
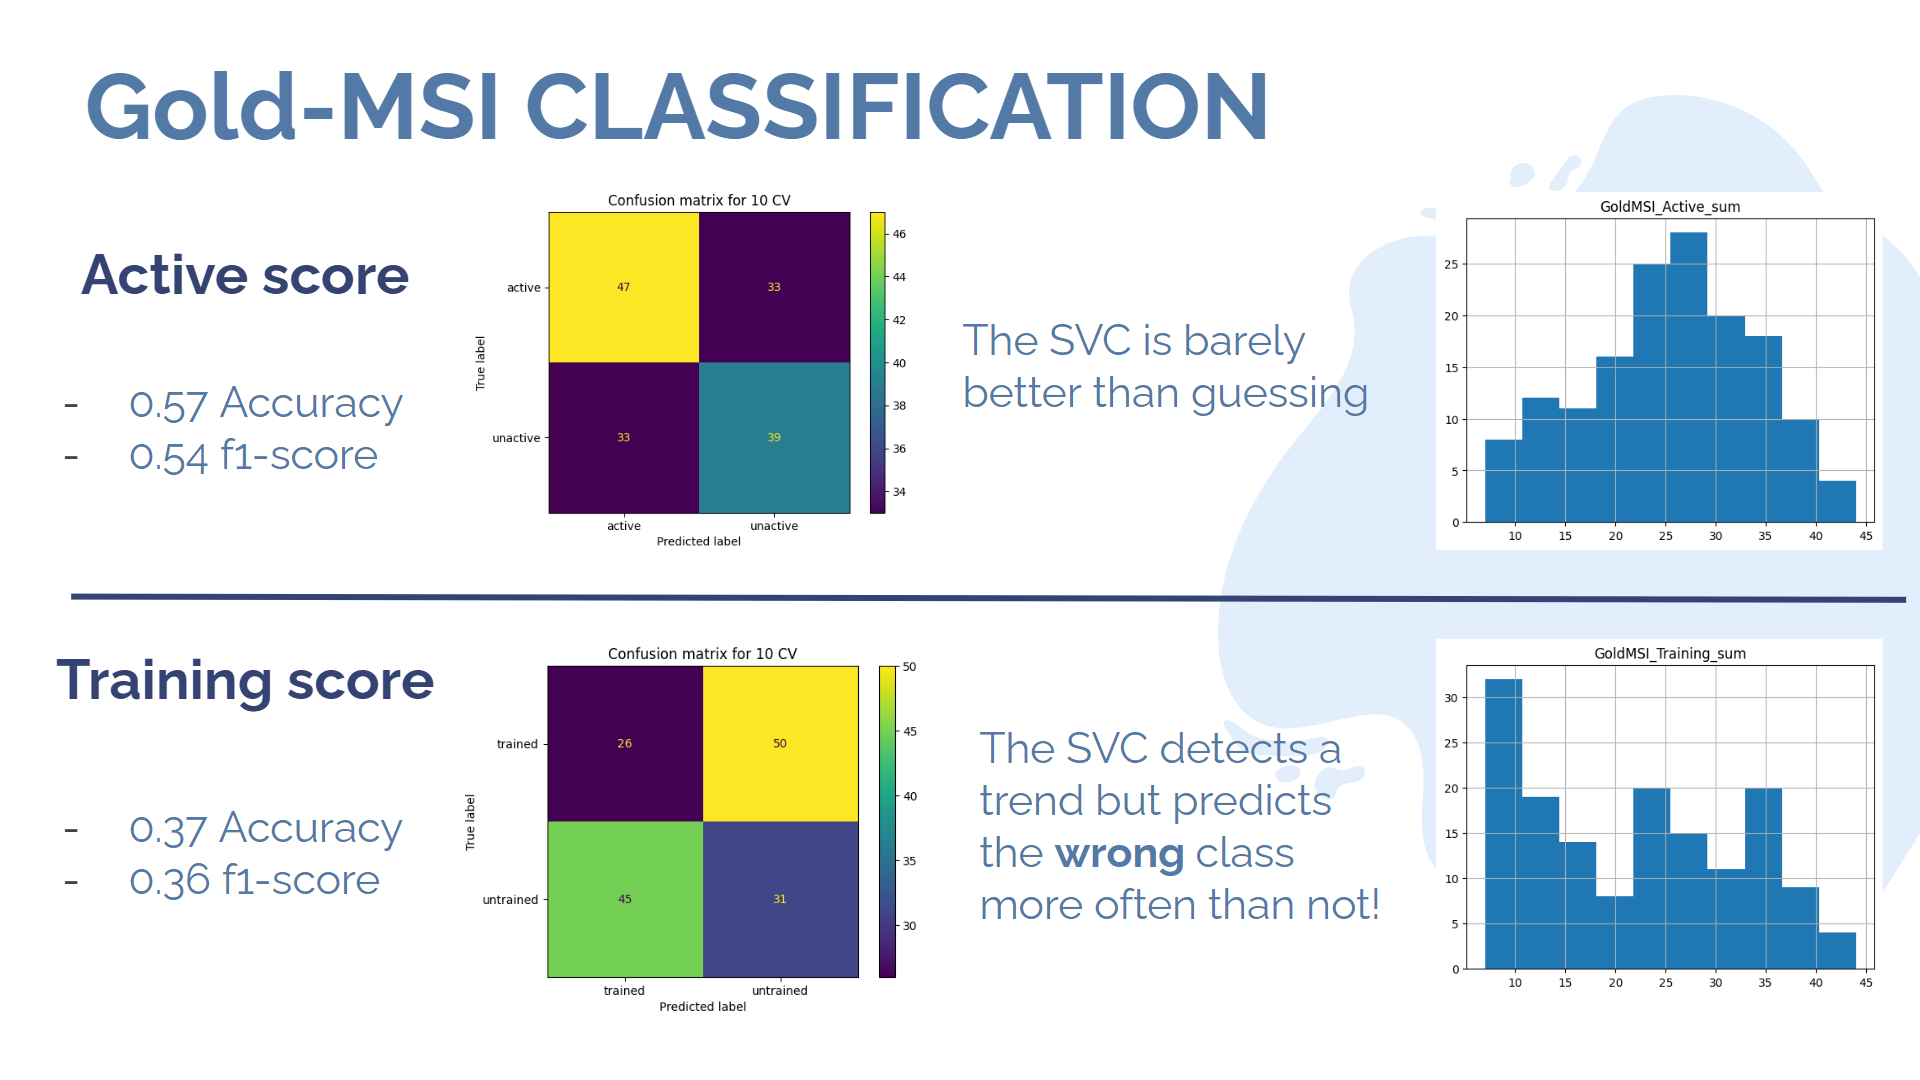
As it turns out, results are barely above average for the prediction of the "active score", which is still an interesting result given our rather brutal method of thresholding, which probably creates a lot of uncertainty around the mean of the gaussian-like distribution of the score. The prediction for the training score, on the other hand, gives us a very unusual result : the algorithm performs significantly below 50%, which means that it is probably identifying meaningful patterns in the data, but it is still classifying incorrectly! This is of course definitely not supposed to happen. I managed to solve the problem by feeding tresholded connectivity matrices to the network instead of untresholded ones, but it is still unclear to me why the problem occured in the first place.
Conclusion
This was an interesting project to have a brief glimpse into the diversity of data analysis techniques that are commonly used nowadays in neuroscience. We could see some diverse and interesting results, and we also highlighted the danger of having an unbalanced dataset at some point. There is still a lot to do, such as for instance performing regression instead of classification on the musical index scores, or computing other metrics derived from graph theory, or trying other model than a SVC/SVR.