PHILIPPE FOREST

Hi! My name is Philippe, and this is my portfolio. I'm interested in neuroscience, music, and recent advances in deep learning. I'm curious, creative, and I try to learn new stuff everyday !
EVOLUTION OF MUSICAL TRENDS OVER THE YEARS WORLDWIDE
This project was realised in collaboration with three other students of IMT Atlantique : Martin Rouesné, Camille François-Martin and Guyllian Gomez.
Dataset and objectives
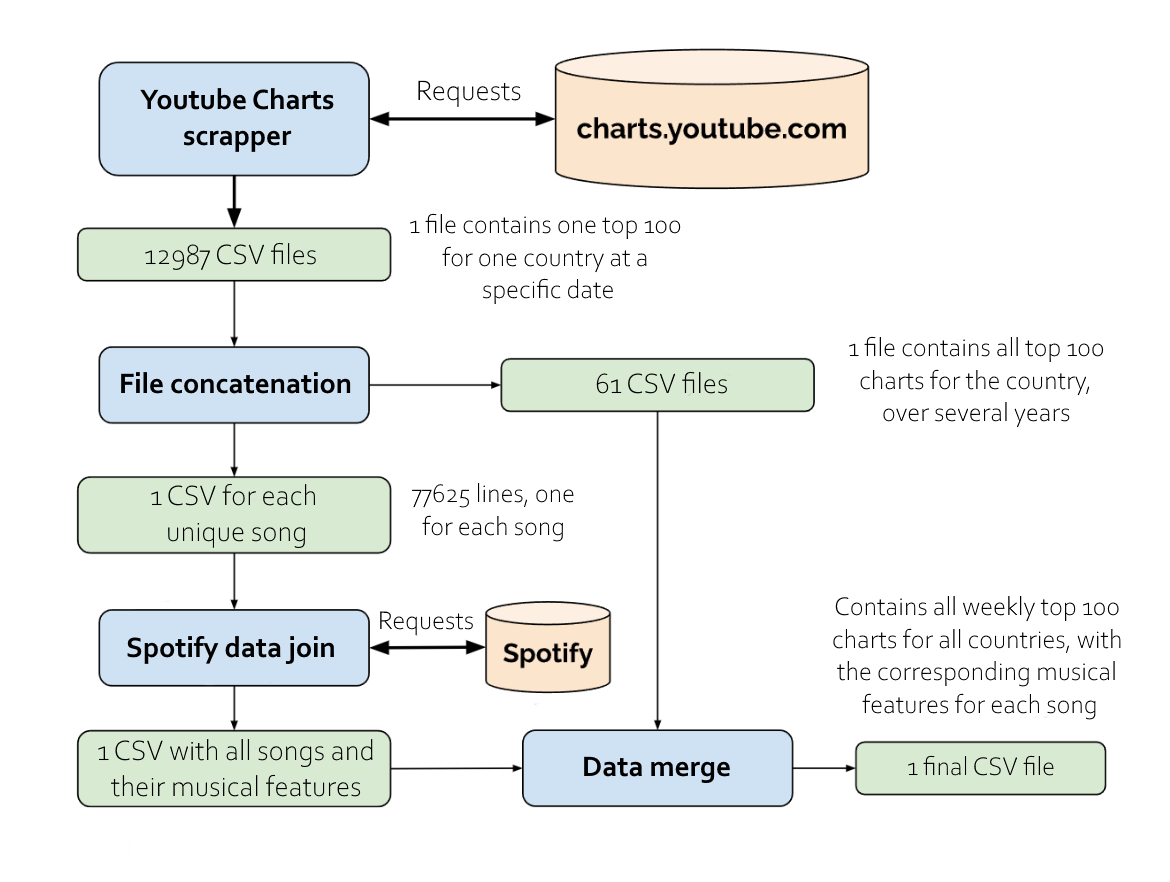
We scrapped the top 100 weekly Youtube charts since 2016 from over 60 countries and analyzed their main musical characteristics using Spotify's API. The API provides informations on various aspects such as the song's length, key, tempo and loudness, as well as pre-made metrics such as "danceability", "acousticnes" or "valence", which describes the felt sadness/hapiness of the song. The following diagram details the way our data was acquired and structured.
Our objective was ultimately to create a model capable of predicting the popularity of any given song in various countries, and at different time periods. This model could serve as tool for market analysis, to guide the promotional campaign of upcoming artists. Before building the model, I was tasked with developping visualizations to help our team better grasp the dataset, and find interesting trends and correlations.
Temporal analysis
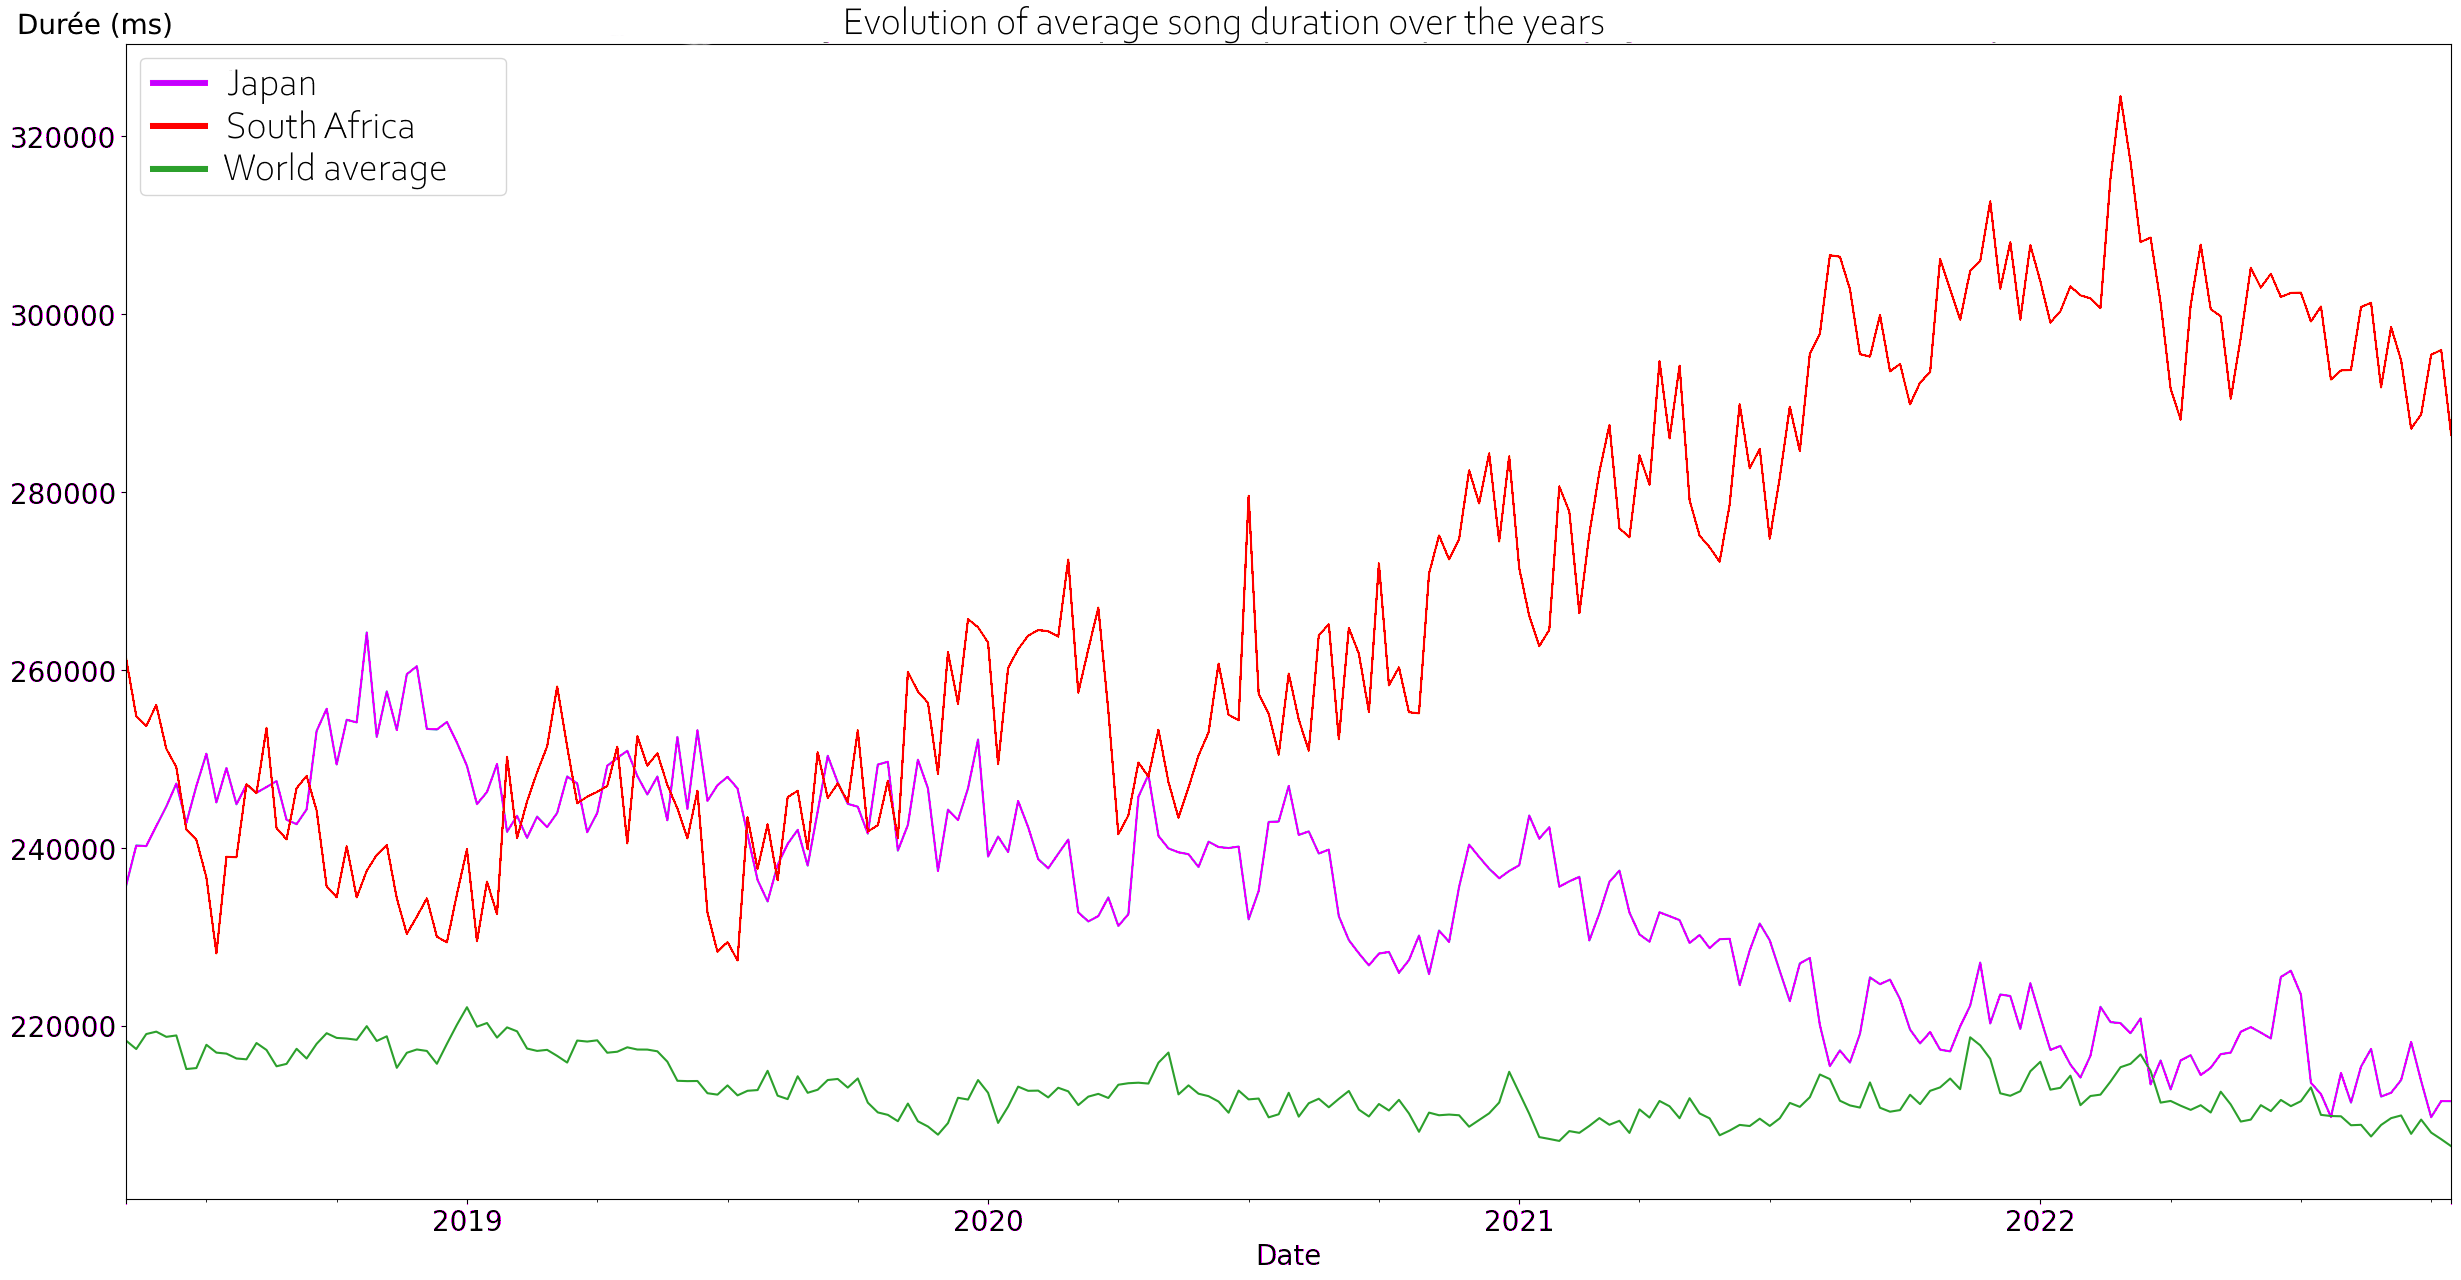
We can perform a first basic analysis by checking the evolution of some characteristics over the years. For instance, the average song duration has increased over the year in some countries, like South Africa, but diminished in other, like in Japan, and has overall stayed the same worldwide.
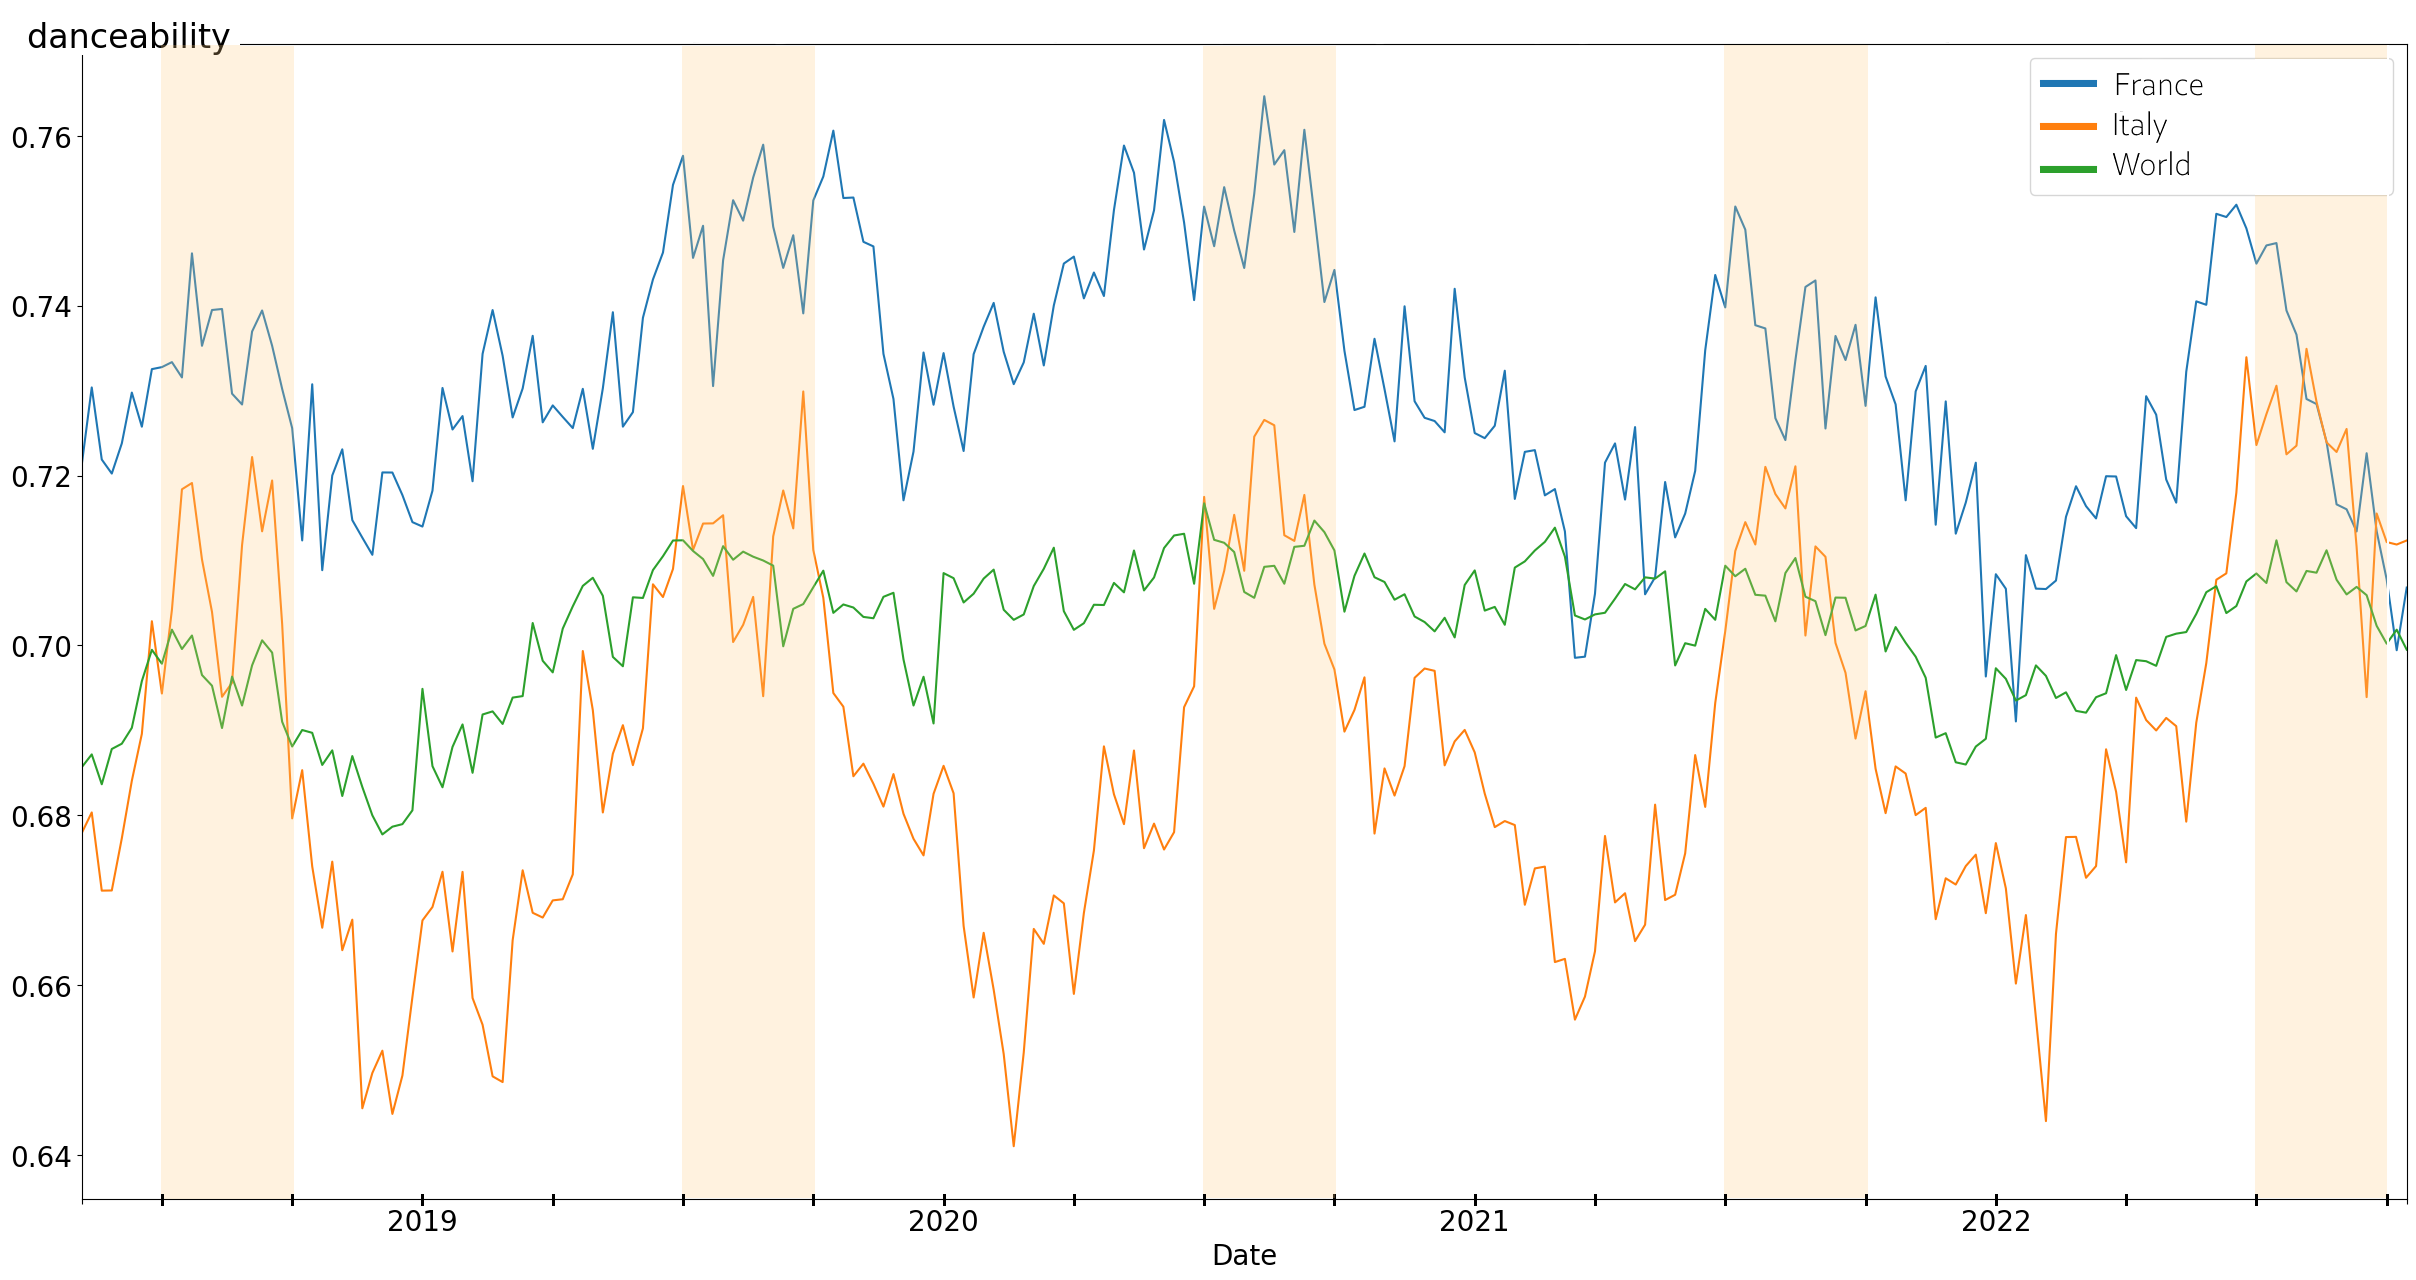
Other characteristics seem to follow a periodic trend. That's the case of "danceability" in Italy and France, which always jumps in summer.
Plotting correlations
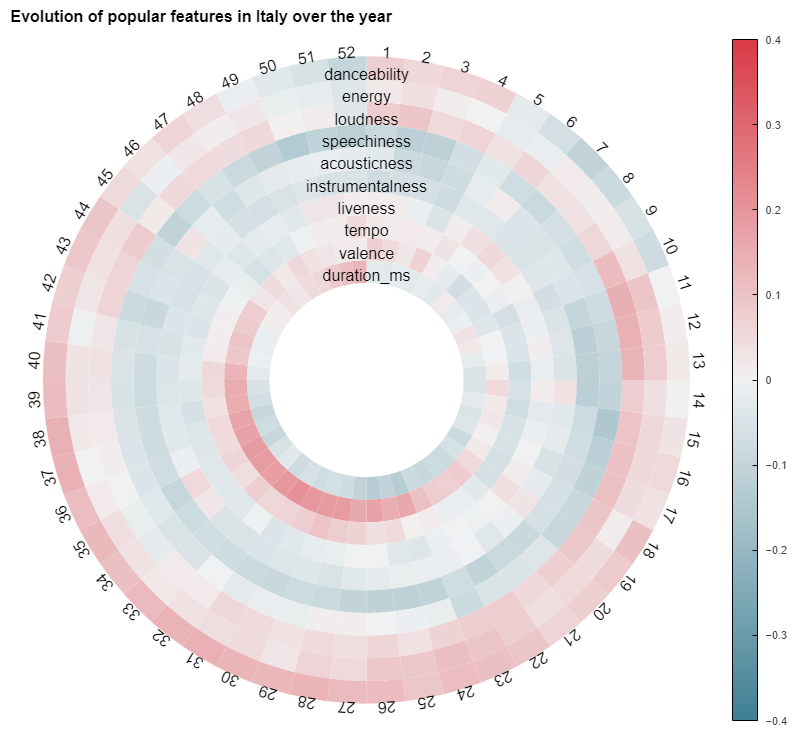
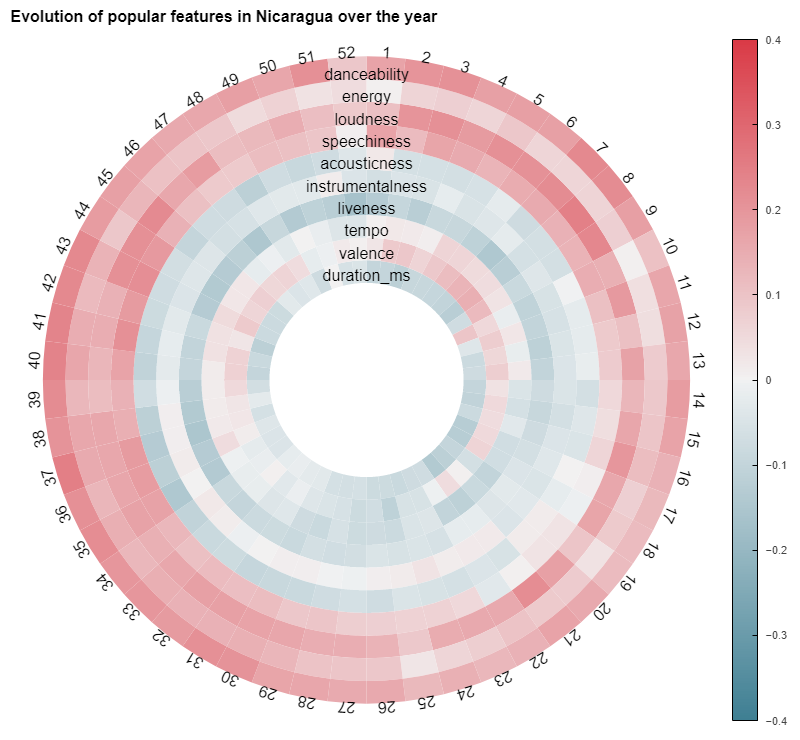
For a more thorough inspection, we can calculate the correlation between each characteristic and the average performance of songs possessing this characteristic in a country. We can also split the results by week for maximum specificity. This gives us some nice insight that I chose to display in a circular fashion to account for the periodic nature of musical trends that we highlighted above. This powerful way of vizualising gives us immediately the broad trend over the year for a specific country. For instance, in Italy, There seem to be a massive popularity "of high-valence" (aka happy) songs between the weeks 25 to 24, which corresponds roughly to summer.
Though this could be easily expected, there are still huge differences in the correlations across various countries. For instance, the Nicaraguan wheel looks rather different from the Italian one :
Just for fun, let's plot every country at the same time and animate based on the current week of the year
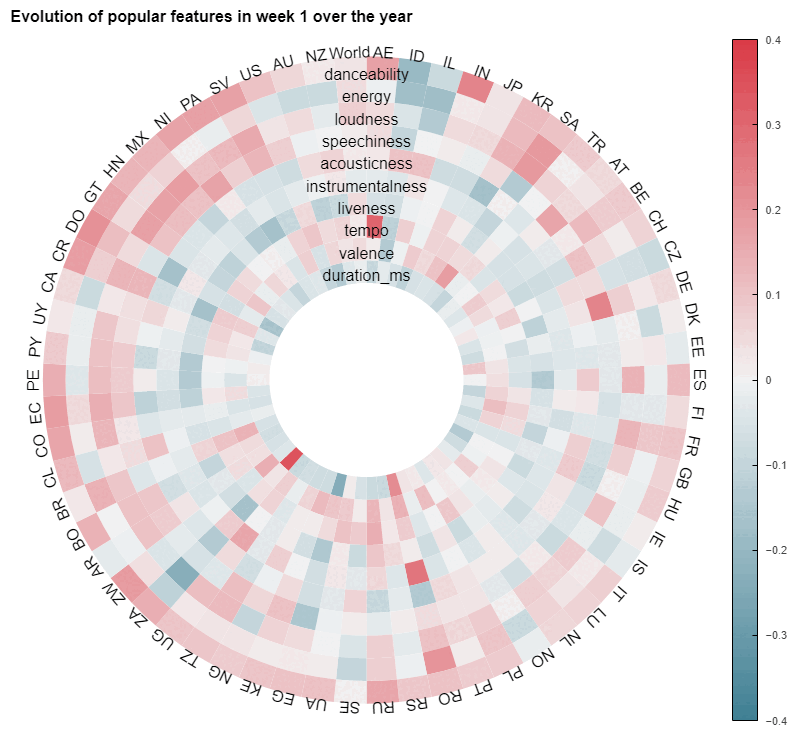
Even though this last animation highlights both a great diversity across countries and some variability over time, we need to keep in mind that the correlations showed here are rather weak on average, as most of them are below 0,2. This is a hint that it would be hard to produce a predictive model based solely on these explanatory variables.
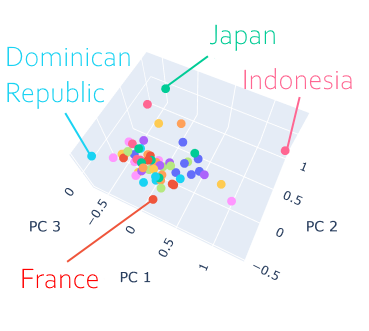
PCA exploration
We can make another interesting visualization by performing PCA on the 10 explanatory variables, and plot each countries in the resulting latent space. This allows us to see immediately which countries are "close" to each other and which one are "far away" in their musical tastes. From this first plot, it appears that Dominican Republic, Indonesia and Japan like very different songs.
Let's color the points by continent :
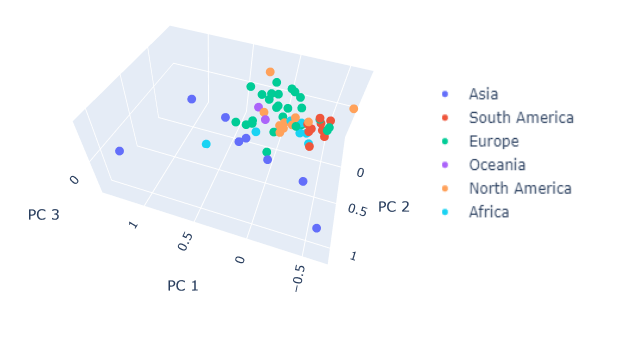
Interestingly, it seems like Europe has overall similar tastes, South America has very similar tastes, which could maybe be explained by the massive popularity of Reggaeton in the whole continent. The pale blue dot separated from the rest of the African countries is South Africa, but it is Asia that seems to have the most diverse musical culture overall.
Conclusion
That's the bulk of the data vizualisation I performed for this project. Of course, with such an interesting and rich database, there is a lot more that could be said, but for the purpose of this project, the aim of this work was to explore possibilities to guide our effort in the making of a predictive algorithm using only the musical characteristics provided by Spotify. As we have seen from the weak correlations obtained, even after segmenting the data by country and time, it was to be expected that even our best classification model, which turned out to be an XGBoost algorithm, would struggle to yield satisfying results. I believe therefore that this study is a perfect illustration of the importance of these kinds of preparatory steps before investing time and money building a model. In this case, it would have been good to try to include more variables to see if it could add more explanatory power.